Coworking Continues to Grow
How much coworking space is there in the US?
JLL estimated about 52 million total square feet of coworking space in the US for Q4 2017. Since 2010, coworking’s been growing at a rate of 23% per year. If that rate continues, there will be nearly 100 million square feet of coworking space in the US by 2020.
Following that fast growth of coworking, the number of people coworking in the US will surpass 1 million by 2022. There are already over 542,000 people working in US coworking spaces, according to Statista.
Following that fast growth of coworking, the number of people coworking in the US will surpass 1 million by 2022. There are already over 542,000 people working in US coworking spaces, according to Statista.
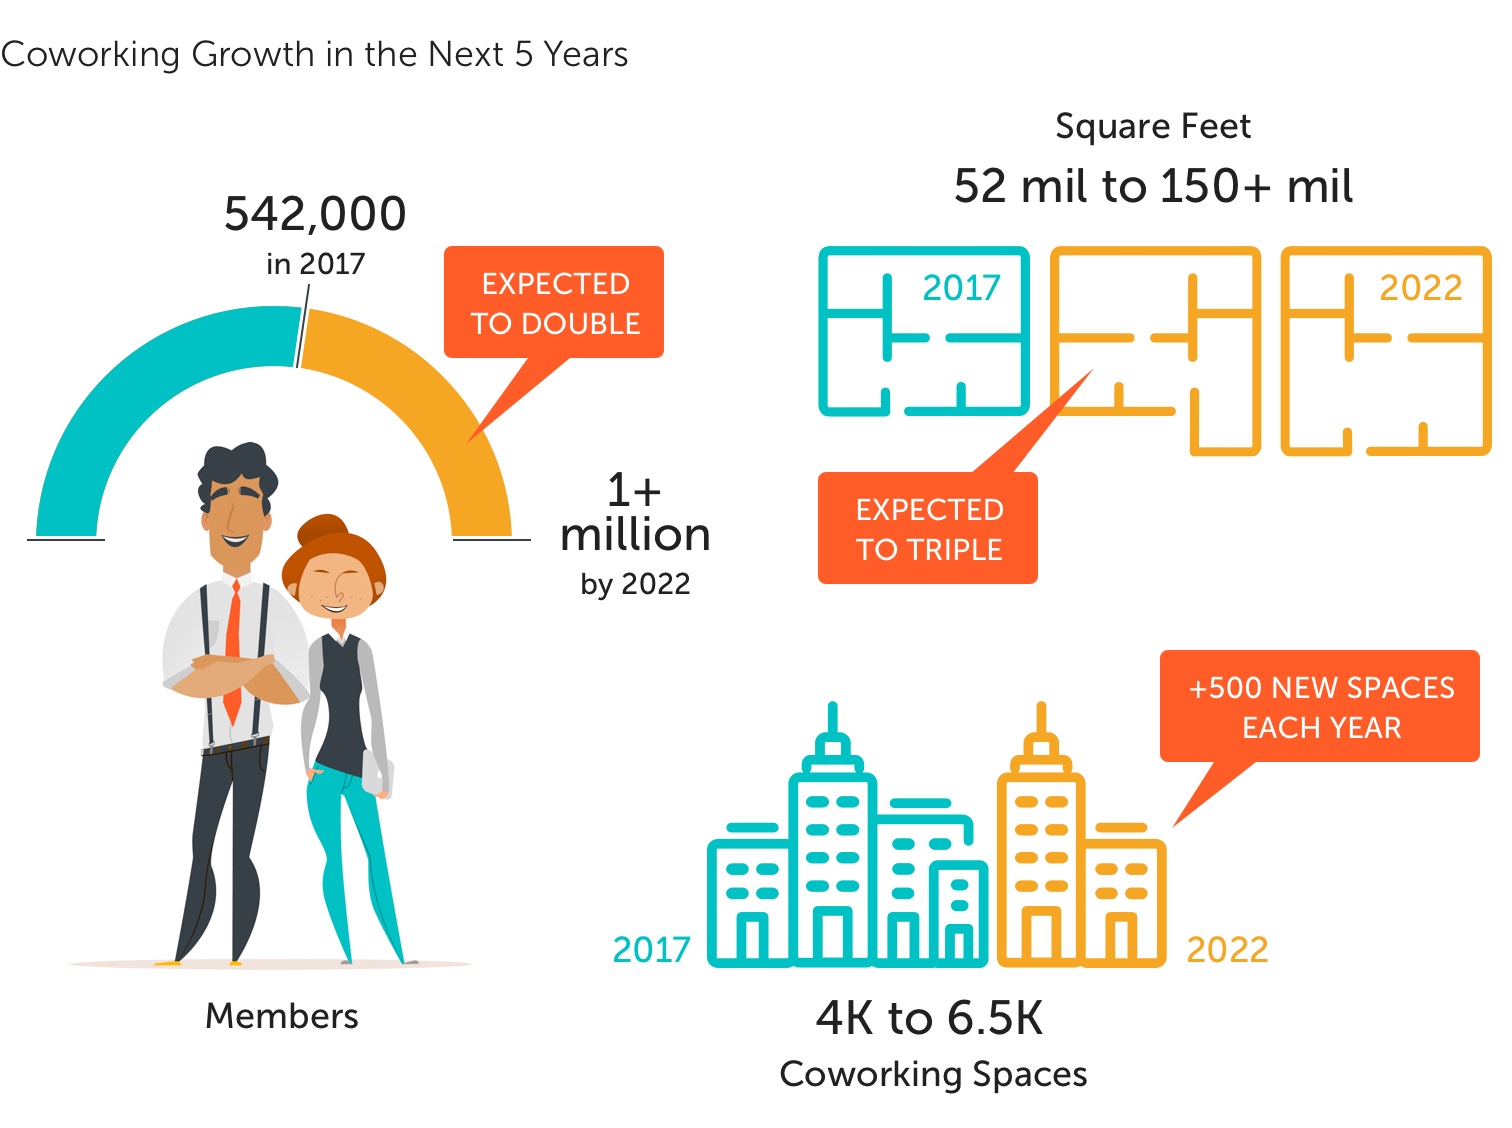
A US coworking forecast by Small Business Labs found 4,043 coworking spaces in 2017.
That study anticipates a 12.5% increase in the number of US coworking spaces in 2018. The growth rate is set to slow over the next five years, but not significantly. The number of new coworking spaces will be around 500 each year, until 2021. The same study also estimates the number of coworking members at more than half a million in 2017. There were approximately 542,000 US coworking members in 2017, with that number poised to increase to 638,000 in 2018 and 754,000 in 2019.
On LiquidSpace, there are 4,168+ individual workspaces in coworking environments, immediately available on monthly terms. That number does not include the thousands more available coworking workspaces in the LiquidSpace extended network, which adds inventory from some of the world’s largest coworking and serviced office providers.
On LiquidSpace, there are 4,168+ individual workspaces in coworking environments, immediately available on monthly terms. That number does not include the thousands more available coworking workspaces in the LiquidSpace extended network, which adds inventory from some of the world’s largest coworking and serviced office providers.
LiquidSpace is the largest network for flexible office space.
Built to simplify the discovery and transaction of commercial real estate, our network has facilitated over 3 million transactions and connected over 64K teams and companies to more than 2,800 office locations in over 730 cities.
Find and book space on flexible terms, from 1 hour up to 3 years.
Tech Continues to Soar
In 2017, the tech industry was the largest contributor to national office leasing, according to JLL.
Tech accounted for 29.9 million sq/ft of deals over the course of the year.
This is the fourth consecutive year that tech accounted for the greatest amount of office space leasing of any industry. Within the tech industry, as large and enterprise level companies continue adopting flexible office at a higher rate, the effect of tech on flexible real estate will rise.
The Global Market Perspective Research from JLL highlighted the most significant deals from Q4 2017. If we break down the total square feet transacted, by-industry we see some staggering results. That data shows startup and tech companies as the dominant force in commercial real estate transactions.
The Global Market Perspective Research from JLL highlighted the most significant deals from Q4 2017. If we break down the total square feet transacted, by-industry we see some staggering results. That data shows startup and tech companies as the dominant force in commercial real estate transactions.

Top Markets Dominate
A recent study quantifying the coworking market showed there’s 26.9 million sq/ft of coworking in the US’s top 20 markets.
The real total amount of coworking spaces is much higher, around 4,000 venues, as this study only accounted for the top 20 markets in the US. In those top 20 US markets, the study accounted for 1,166 coworking venues.
Comparing research from the top 20 US markets to the US totals, it’s easy to see how significant top markets are to flexible real estate. These top 20 markets accounted for approximately 29% of all US coworking inventory. That is, nearly a third of all coworking venues in the US are in just 20 US cities. For simplicity’s sake, we’ll refer to this consolidation of flexible office in top markets as the “top market effect”.
Comparing research from the top 20 US markets to the US totals, it’s easy to see how significant top markets are to flexible real estate. These top 20 markets accounted for approximately 29% of all US coworking inventory. That is, nearly a third of all coworking venues in the US are in just 20 US cities. For simplicity’s sake, we’ll refer to this consolidation of flexible office in top markets as the “top market effect”.
The Top Market Effect
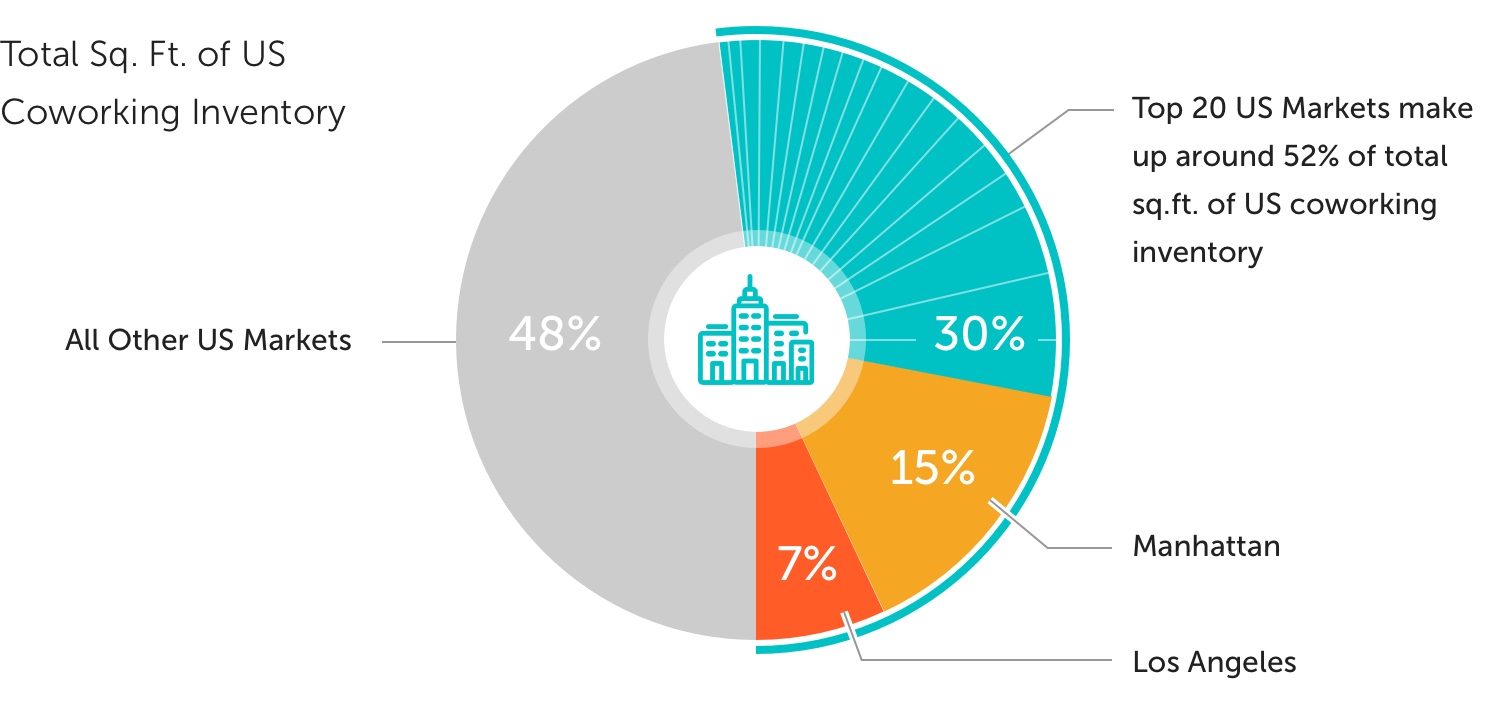
In terms of total square footage, this top market effect is even more powerful. The total square footage of coworking inventory in the top 20 US markets makes up nearly 52% of all US coworking inventory. Thus, you’ll find that more than half of all the coworking space in the US is consolidated into 20 markets. On LiquidSpace, we see a similar trend of lots of coworking inventory in dominant markets. For example, out of the approximately 4,200 coworking workspaces immediately available on monthly terms on LiquidSpace, more than one third of those workspaces are located in just two cities – New York and San Francisco. For reference there are approximately 1,100 coworking workspaces in NYC and about 420 coworking workspaces in SF. These numbers account for individual workspaces, not venues, but still this top market effect is extremely relevant for commercial real estate firms and flexible office providers.
“It often makes sense to invest heavily into highly trafficked neighborhoods in big cities.”
When we compare the top 20 US markets to all US markets, the disparity between the total number of coworking spaces and the total square footage becomes evident. The top 20 markets represent about a third of all US coworking venues, but the total square footage in those markets is more than half of the US total. From this we can garner a few insights. Primarily that coworking venues in top markets are on the whole larger than their secondary market counterparts.
What’s the reason for this disparity? Why do top markets have so much more total square footage than other markets? One likely reason is that the biggest providers of coworking space are making huge investments into these top markets at a few locations. Real estate tends to be hard to come by in top markets – plus top markets tend to be dense. That means, it often makes sense to invest heavily into highly trafficked neighborhoods in big cities. For one, large coworking providers can get a better price per square foot in bigger deals. And, two, there just isn’t that much ground to cover in many of the top US markets. Also, in smaller markets, much of the coworking inventory comes from smaller providers. Plus, the biggest coworking providers haven’t fully built out inventory in secondary markets.
What’s the reason for this disparity? Why do top markets have so much more total square footage than other markets? One likely reason is that the biggest providers of coworking space are making huge investments into these top markets at a few locations. Real estate tends to be hard to come by in top markets – plus top markets tend to be dense. That means, it often makes sense to invest heavily into highly trafficked neighborhoods in big cities. For one, large coworking providers can get a better price per square foot in bigger deals. And, two, there just isn’t that much ground to cover in many of the top US markets. Also, in smaller markets, much of the coworking inventory comes from smaller providers. Plus, the biggest coworking providers haven’t fully built out inventory in secondary markets.
Flexible Inventory by Market
On average each coworking venue in a top 20 US market represents approximately 23,000 square feet. In all other markets, each coworking venue represents approximately 8,700 square feet per location. We might assume that, on average, coworking venues in top markets are three times as big as those in smaller markets. But, the statistics are likely skewed because of the immense size of a handful coworking venues in large markets.
Enterprise level companies often lead the charge in occupying large coworking spaces. And enterprises are increasingly adopting flexible real estate.
IBM did it in April of 2017, with a 70,000 sq/ft deal at a top coworking provider.
More recently, Amazon followed suit. In November 2017, Amazon signed a deal to occupy this coworking provider’s entire inventory – 122,000 sq/ft, at the provider’s Herald Square location in New York City.
One company, at one venue is significantly impacting the flexible office landscape. This deal is representative of the shift in how enterprises occupy flexible office and coworking inventory.
Thus, we expect to see more, similar large flexible office deals down the line. It’s goliath deals like this which account for the aforementioned disparity and contribute to this top market effect.
“Enterprise level companies often lead the charge in occupying large coworking spaces.”
In top markets with more total acreage than the likes of NYC and SF, the consolidation of inventory can be even more significant.
For example, there’s a Level Office location in Denver with more than 125,000 sq/ft of space at that single venue.
That’s nearly 11% of the entire flexible office footprint in Dallas, by total square footage.
In top markets like Denver where there’s more space and cheaper real estate than the biggest US cities, the opportunity to expand flexible real estate comes with huge potential and a smaller price tag.
A Complete Market View of Coworking Inventory
Understanding that there are 20 US cities making up more than half of all the coworking inventory in the nation, the LiquidSpace team sees a clear next step for integrating all the coworking space in the US into our available and extended Network.
Starting by filling in the gaps in these top cities, LiquidSpace is now mapping 100% of all US coworking providers to leverage our platform and onboard the goal stock of their available or soon to be available office inventory.
“LiquidSpace is now mapping 100% of all US coworking providers to improve the discovery and transaction experience
of flexible office.”
Our goal is to have 100% of inventory in the coworking realm available on the LiquidSpace platform. Doing so, will offer tenants a complete market view into US coworking options. Already LiquidSpace has a huge chunk of this inventory immediately available, and lots more in the extended network. But, we’ll continue to call on coworking venues – new and old – to leverage the technology of our platform and help improve the discovery and transaction experience of flexible office.
Average Monthly Rent per Person in US Markets
Average Rental Rates are calculated by dividing the asking rental rate by the maximum capacity of each space.
Sources
https://www2.colliers.com/en/research/2017-Q4-US-Industrial-Market-Outlook-Report
https://www.nar.realtor/sites/default/files/documents/2017-q4-commercial-real-estate-outlook-11-29-2017.pdf
http://www.us.jll.com/united-states/en-us/Research/United-States-Office-Outlook-Q4%202017-JLL.pdf?56ed613a-dcac-476a-9592-1c48a8e1a119
http://www.smallbizlabs.com/2018/02/study-finds-us-has-27-million-square-feet-of-coworking-space.html
https://www.yardimatrix.com/Publications
http://www.deskmag.com/en/1-7-million-members-will-work-in-coworking-spaces-by-the-end-of-2018-survey
https://www.dropbox.com/s/rjbmdo4wp4aeccx/2018%20Complete%20Coworking%20Forecast.pdf?dl=0
http://www.information-age.com/need-enterprise-innovation-rd-teams-work-together-123470778/