Today’s Workforce Craves Flexible Offices

US Flexible Office Report Q1 2017

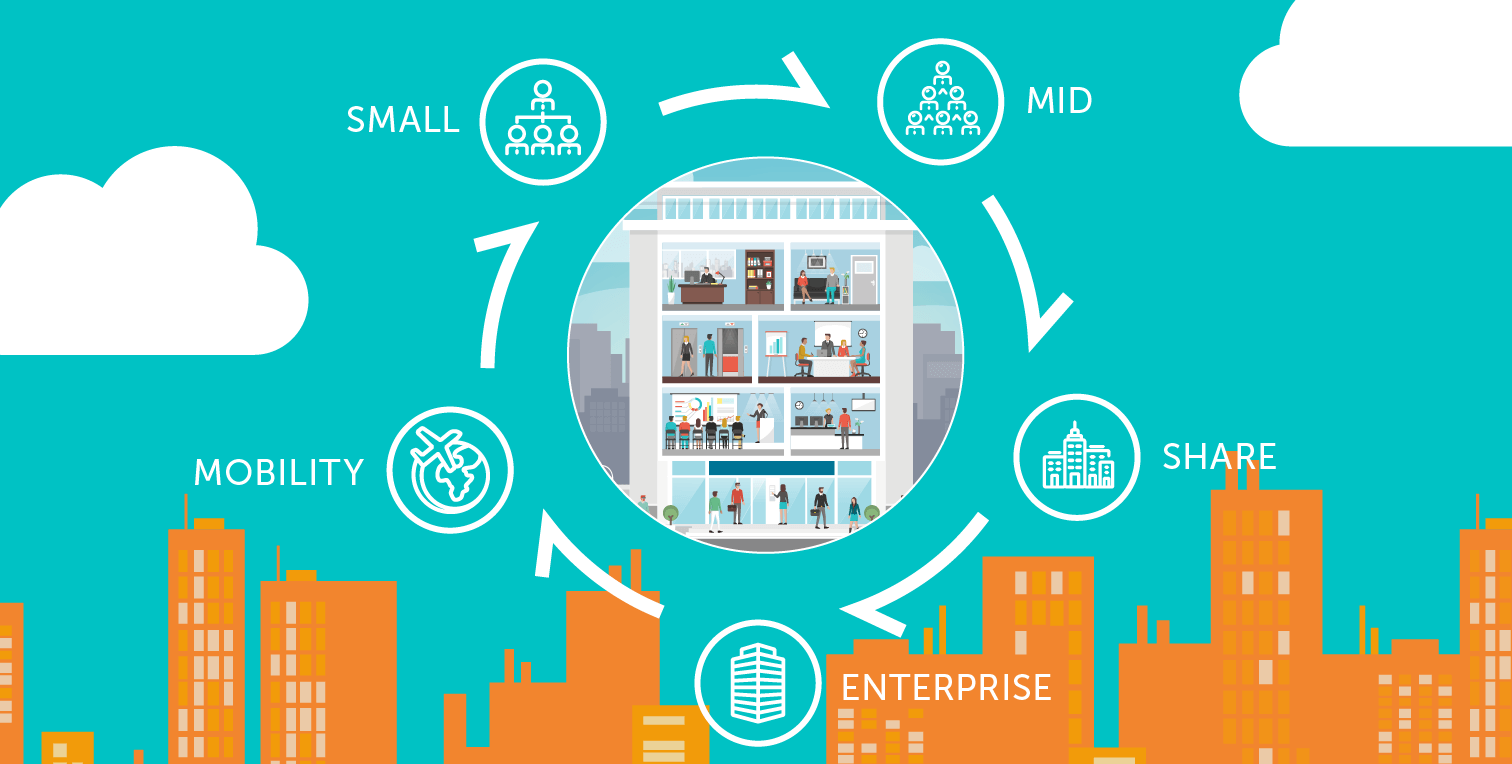
Workplace Shifts Driving the Demand for Flexible Office
Technology and Information are Forcing Commercial Real Estate to Adopt a Flexible Model

The US labor market continues to grow more competitive, with the national average for unemployment hovering around 4.5%. The competition is even tighter in many of the most popular cities for new companies like San Francisco (3.5%), Salt Lake City (3.2%), and Boulder (2.7%). The scramble to fill IT employee vacancies is a difficult one, with a recent estimate of the backlog of unfilled IT positions at 545,000. In this battle to attract and retain the best employees, flexible office solutions can be a potent weapon. Companies have started to realize the value of flexible office solutions in this fight for top talent.

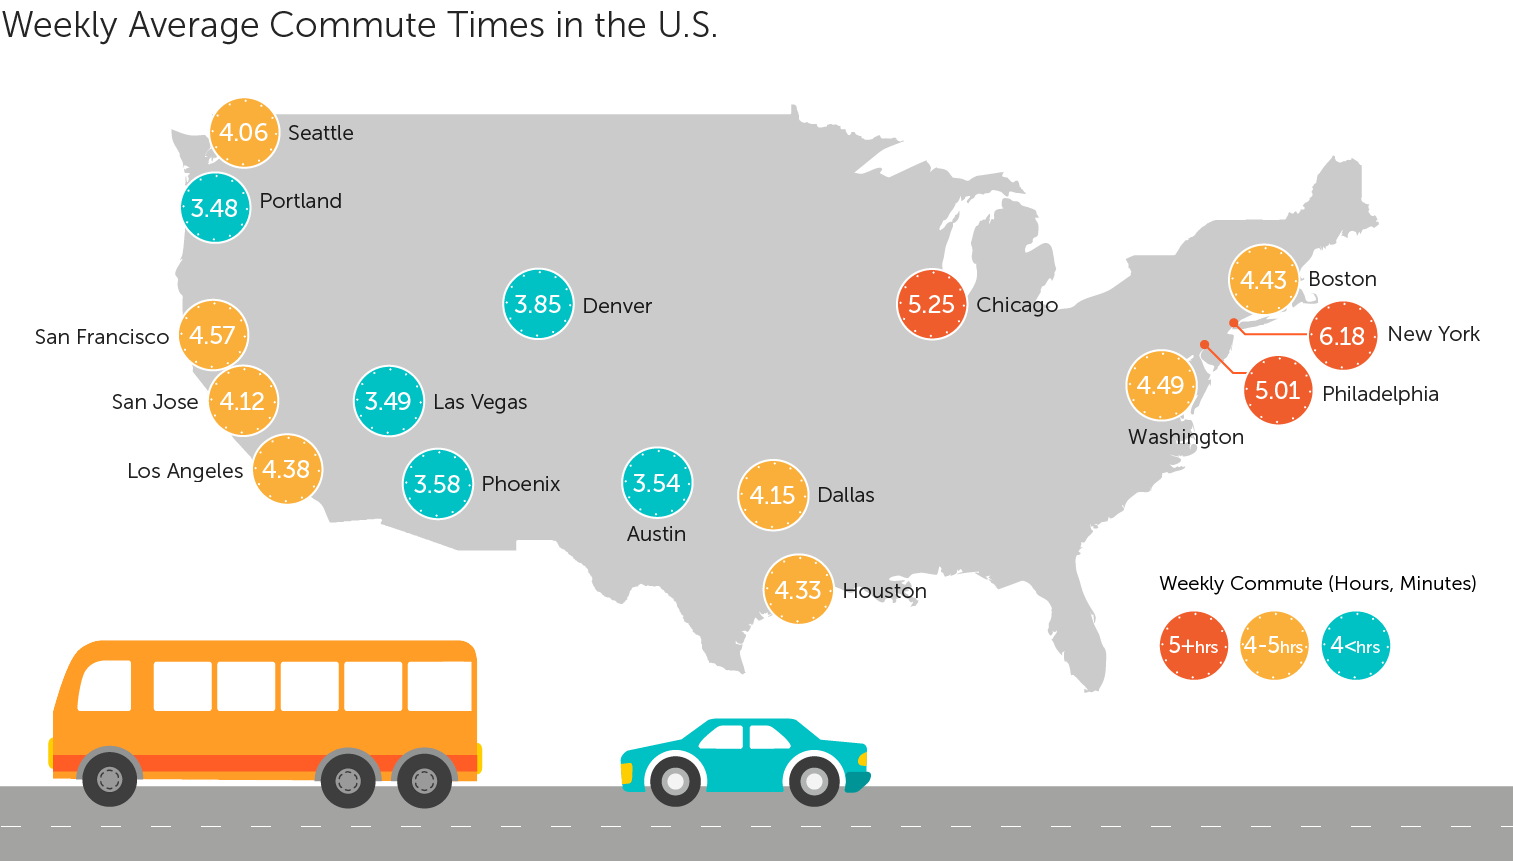
The same rapid job growth in these “super cities” is leading to worsening traffic and longer commute times. In the San Francisco Bay area, for example, traffic has increased between 43-81% on the region’s cross-bay bridges. And that’s just in the last 5 years. San Francisco’s average commuting time (4.5 hours per week) now ranks 4th in the nation, trailing Chicago (5.3 hours), and New York (6.2 hours).

Weekly Average Commute Times in the US
People not only hate commuting, but there is also a significant body of evidence that commuting can negatively impact both work performance and health. In a study of people’s regular weekly activities, commuting ranked as the most unpleasant of all activities. One recent study showed, after a long commute individuals performed markedly worse at proofreading, a standard way to measure accuracy and motivation at work. The negative effects of commuting on health are well established, with longer commute times tied to recurrent back and neck pain issues, increased risk of obesity, and other stress related diseases.

“… commuting can negatively impact both work performance and health.”

LiquidSpace is the largest network for flexible office space. Built to simplify the discovery and transaction of commercial real estate, our network has facilitated over 3 million transactions and connected over 64K teams and companies to more than 2,800 office locations in over 730 cities. Find and book space on flexible terms, from 1 hour up to 3 years.
Quantifying the full impact of reduced commute times on employee happiness and company performance is a challenging exercise. But, even a quick review of some basic numbers is compelling. For example, a typical US software engineer, has a salary of roughly $95,000, commutes 4.5 hours per week on average. If a company could capture just 2 hours a week of work back from that 4.5 hours spent commuting, that would translate to an additional 104 hours of work per year, worth $4200.
Wall Street
We find another benefit of reduced commuting in its ability to improve employee retention. Recent studies suggest that workers with short commutes have lower turnover and absenteeism among employees. On average those with short commutes stay 20% longer with a company than those with long commutes. Replacing workers, particularly highly skilled and paid knowledge workers, is expensive, and the cost of hiring actually rises with the level of compensation. The costs to replace these workers can range from 50-200% or more of their annual salary. Again, using the example of a US software engineer with an average salary of $95,000, the average tenure is just 3 years. If we assume the mid-point for replacement cost, at 100% of their salary, a 20% increase in tenure translates to a savings from replacement cost of $5277 per employee, per year.

“An ideal model might balance several days a week of remote working, from a coworking location, and a few days in the central office.”

With this much evidence to support it, the case to offer remote working options is compelling. Employees overwhelmingly favor remote work, with employee surveys showing that 80-90% of employees would like to work remotely at least some of the time. But anyone who has worked from home or a coffee shop realizes both options can be rife with distractions. Offering access to a flexible office space close to an employee’s home might be the perfect mix of both. The worker gets the benefit of reduced commute times, plus a dedicated space to get work done. While each company and individual is different, an ideal model might balance several days a week of remote working, from a coworking location, and a few days in the central office. This model gives workers a mix of options for “working time” in a remote office and “meeting time” in a central office.

Benefits of Flexible Workspace for Building Owners
Stay Up to Date as You Work Towards 100% Occupancy
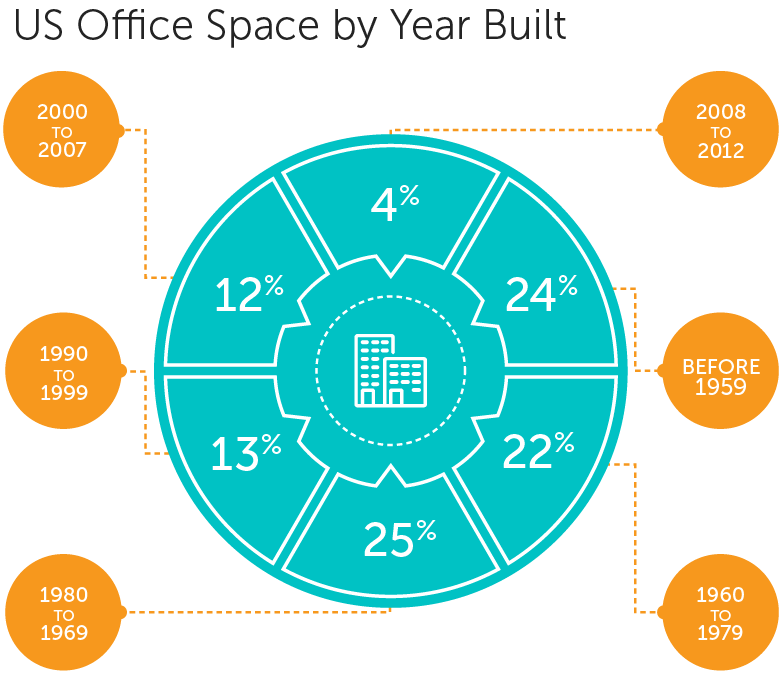
The overall US commercial office stock continues to age in place. According to the most recent Commercial Buildings Energy Consumption Survey, more than 70% of the 16 billion square feet of office space in the US is in buildings built before 1980. As owners across the country look for ways to revitalize and reposition these buildings, creating flexible spaces has emerged as an ideal option to capture some of the most desirable office tenants.
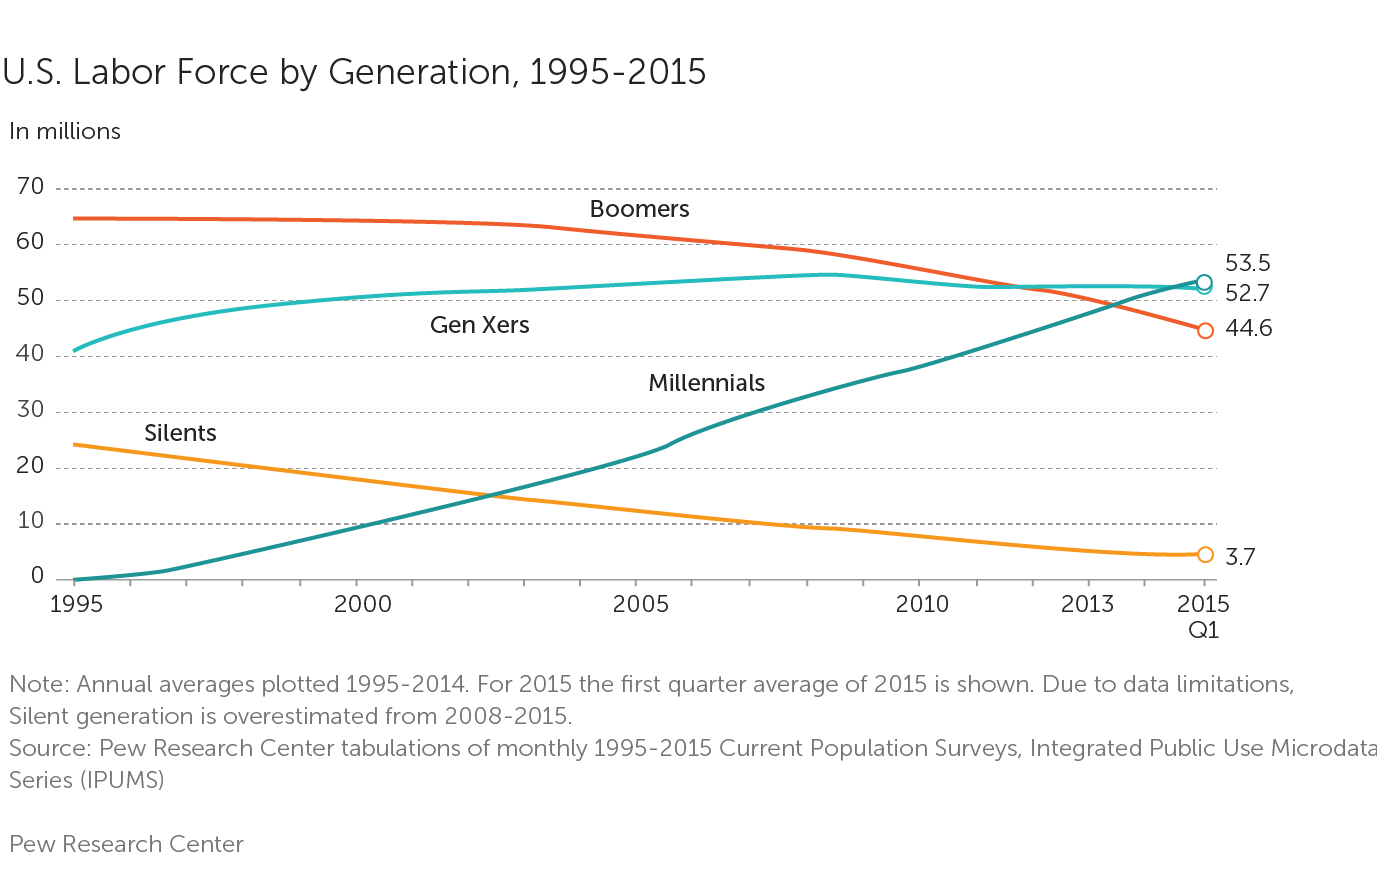
Millennials are increasingly dominating the workforce. Thus, the most sought after office space has shifted to more open floorplans, communal soft seating, and collaborative spaces. The growing presence of startup and tech clients – that have generated some of the most significant job gains over the last decade – have driven this shift. A look at employment growth shows that technology related jobs have grown at twice the rate of other professions that require office space.
US Office Space by Year Built
Many factors are exacerbating the pressure to appeal to this demographic. The steady decline, over the last 15 years, in square footage per employee is just one factor. This decline in space per employee is disproportionately represented in Class B space, where there’s been an 8.8% decline. Similarly, in Class C space square footage per employee has dropped 18.4% over the last decade. We typically see these reductions during lease renewals, fairly consistently come across sectors. But, computer and data companies are the one bright spot. These companies have actually increased their per square foot ratio, as they increasingly use amenity rich space as a driver to attract on-demand tech employees.
US Labor Force by Generation
As real estate owners think about ways they can attract desirable tech tenants, many have realized they need to start building a relationship with these companies earlier in their company lifecycles. Young companies are the engines of new job growth in the US. Recent studies of the US labor markets show that it is young firms, those less than 5 years old, that are responsible for the creation of the majority of net new jobs in the economy. There is also strong evidence that the inertial forces tend to keep corporations at or near the location where the companies were initially started. Forward-thinking developers such as the Irvine Company in Southern California are using flexible spaces and transactions as a bridge to attract young companies as tenants to their projects. As these young companies mature and grow they create organic demand for additional space among their existing tenant pool and help form a steady pipeline of deals in their portfolios.
Warehouse

Many of the older and more unique buildings that owners have struggled to reposition as traditional office space can, with a little creativity, position themselves as flexible office spaces. The Swig Company partnered with The Port Workspaces, an Oakland based coworking operator, to redevelop a former department store space in Oakland. They turned unused space into a coworking campus and brought a host of new young tech tenants to Oakland’s revitalized Uptown district. The success of the project and the life it brought to the neighborhood also helped to drive additional interest in Swig’s adjacent office tower.

The growing list of owners looking for ways to make portions of their inventory available on more flexible terms was a driving factor behind the launch of our altSpace program. (see altSpace sidebar for more details) In collaboration with BVN design and furniture partners, the altSpace program uses a mix of pre curated designs and modular furnishing kits to deliver spaces that are flexible, beautiful, cost efficient. LiquidSpace can deliver an altSpace in just 60 days while vastly reducing the potential tenant improvement costs apparent in traditional deals.

Tailored Office Fit-outs, with Terms as Flexible as the Space
Kit Tailored

altSpace by LiquidSpace has reimagined how creative offices are designed, delivered and occupied for growing teams of 10-200 people. We combine licensed, turn-key office space with LiquidSpace-approved landlord partner spaces. Our prefab office space solution is created in partnership with BVN Architecture and furniture partners.

Along with the space and fit-out, the altSpace services layer provides design consultation, IT procurement, and a LiquidSpace concierge to help manage facility needs.

Find out more at
www.liquidspace.com/altspace

Companies Use Flexibility Across Their Lifecycles
With the increased growth and availability of flexible office solutions, companies ranging from early stage startups to large multinational enterprise corporations are using flexible office options throughout their lifecycles as a company. The reasons driving this are unique to each company but a few common scenarios emerge in reviewing the flexible landscape. Here’s a quick overview of how a single company might use flexible office solutions throughout its full lifecycle:
Company Cycle
Early Stage
Early Stage Small (<10) Dynamic Teams Looking for Shared Spaces as Their First Office

Getting office space is often a watershed moment in the launching of a new company. Often that first office is in a shared environment like a coworking space or executive office center. The initial financial and legal commitment to rent these spaces is lower than in a traditional space, with many spaces available, in sizes as small as a single desk. Companies can rent spaces in blocks of hours, days, weeks, months or years. The ability to quickly add additional desks in the space makes this solution a great one for the early days of dynamic growth. Shared work environment also have advantages that go beyond simply the financial and structural elements. Companies also gain access to the type of amenities found in larger offices with shared front desk staff, conference rooms, and kitchens. There is also something said for being a part of a larger office social environment. Interacting with others can help a small company avoid cabin fever, and enables employees to draft off the energy of similar teams and individuals in the space.

Typical Start-up Timeline
Midsize
Midsize (10-200) Teams Looking for Their Own Space

As a company grows and crosses the 10 person threshold, the benefits of flexible still hold a ton of appeal. Team this size often start seeking more private spaces in the flexible realm. A combination of factors often drive this decision, including a need for confidentiality, a desire to build a distinct team culture, and the underlying social factors of having a large team in a shared environment. In short, once a team grows larger they may feel uncomfortable as the natural increase in conversations and meetings of a larger team, can be disruptive to the other teams working in the space.

Private spaces in the flexible world come in a variety of forms. Many of the larger executive office centers and coworking spaces include private offices or separate office suites. Private companies also provide significant inventory for mid size teams by sharing extra suites, unused floors, or whole offices that they no longer occupy. Lastly landlords are also increasingly jumping into the flexible ecosystem by providing part of their buildings or portfolio inventory on flexible terms.

Lease Spaces
Lease Spaces and License Extra Space to Generate Cash

At some point in their growth cycle, a company may lease space on a more traditional 5 or 10 year basis. If the company is growing quickly, completing these longer term deals creates a bit of a catch 22. Either the company rents space to suit their needs now, and then quickly finds themselves overcrowded, or back in the market looking for new space, or they lease more space than they need now to give themselves space to grow into. Using the flexible LiquidSpace marketplace, this company can lease a larger space and then share back the additional space on a flexible basis as a way to monetize this additional space until they need it. With options to rent spaces in blocks as small as a single desk all the way up to whole floors. The spaces can be reclaimed with a typical 60 day notice, so the company can better match their occupied space with their current demands and generate additional cash flow along the way.

Other Locations
Use Flexible Space to Quickly Deploy Teams in Other Locations

Once the company has reached a scale when it starts to build teams in other locations, whether a sales, engineering or operations team in another city, flexible solutions provide a quick and easy way to get into a satellite office and house a team wherever that need arises. Companies can deploy flexible solutions rapidly, without all the complexity and work involved in a traditional lease process.

Mobile Workforce
Supporting a Mobile Workforce with Convenient Options

Companies at every stage of their lifecycle use flexible spaces to give their employees options to work where they can be most productive and happy. Rather than ask employees to waste time commuting to a central office each day, companies are creating mobility programs using tools like the LiquidSpace Mobility Manager to allow their employees to work at other locations near where they live. Similarly with workforces that are on the road, or spread across the country companies are giving access to flexible spaces as an alternative to asking their employees to work from home, hotel rooms, or coffee shops. The benefits to employee productivity, retention, and even health from these options is noteworthy.


Average Monthly Rent per Person
Average Rental Rates are calculated by dividing the asking rental rate by the maximum capacity of each space. When no spaces are available, prices are based on historical averages.

-

More Info Contact Andrew Liverman

andrew.liverman@liquidspace.com | Director of Product Marketing | San Francisco, CA

References
¹. “Unemployment Rates for Metropolitan Areas,” U.S. Bureau of Labor Statistics, April 5, 2017, , accessed April 10, 2017, https://www.bls.gov/web/metro/laummtrk.htm.
². Patrick Thibodeau, “Behind the White House’s claim of 545,000 unfilled IT jobs,” Computerworld, March 13, 2015, , accessed April 10, 2017, http://www.computerworld.com/article/2896517/behind-the-white-house-s-claim-of-545-000-unfilled-it-jobs.html.
³.Riley McDermid, “It’s not just you: Bay Area traffic has gotten much, much worse,” Bizjournals.com, November 24, 2015, , accessed April 10, 2017, http://www.bizjournals.com/sanfrancisco/blog/2015/11/bay-area-traffic-worsens-on-bridges-long-commute.html.
⁴.United States, Bureau of Fiscal & Budget Studies, City of New York Office of the Comptroller, NYC Economic Brief “ The Hardest Working Cities”, by Scott M. Stringer (New York, NY: Office of the New York City Comptroller, 2015). http://origin-states.politico.com.s3-website-us-east-1.amazonaws.com/files/Embargoed%20Hardest%20Working%20Cities%20Study.pdf
⁵.Daniel Kahneman and Alan B. Krueger, Journal of Economic Perspectives—Volume 20, Number 1—Winter 2006 Developments in the Measurement of Subjective Well-Being http://dataspace.princeton.edu/jspui/bitstream/88435/dsp016108vb296/7/PDF%20of%20Kahneman%20Krueger%20paper.pdf
⁶. Rail commuting duration and passenger stress. Evans, Gary W.; Wener, Richard E. Health Psychology, Vol 25(3), May 2006, 408-412
⁷. Lopez-Zetina, Javier, Howard Lee, and Robert Friis. “The link between obesity and the built environment. Evidence from an ecological analysis of obesity and vehicle miles of travel in California.” The link between obesity and the built environment. Evidence from an ecological analysis of obesity and vehicle miles of travel in California. December 2006. Accessed April 11, 2017. http://www.sciencedirect.com/science/article/pii/S1353829205000572.
⁸. Housman M, Matlins M, Simkoff M, Tsukuhara C & West N. 2013 Q3 Workforce Performance Report: Key Factors Impacting the Performance and Profitability of Today’s Hourly Workforces, San Francisco, CA: Evolv, Inc: 2013 http://www.businesswire.com/news/home/20130724005971/en/Evolv-Releases-Q3-Workforce-Performance-Report-Uncovers.
⁹. Heather Boushey and Sarah Jane Glynn, “There Are Significant Business Costs to Replacing Employees,” Center for American Progress, November 16, 2012, , accessed April 10, 2017, https://www.americanprogress.org/wp-content/uploads/2012/11/CostofTurnover.pdf.
¹⁰. “Salary: Software Engineer.” Glassdoor. April 7, 2017. Accessed April 10, 2017. https://www.glassdoor.com/Salaries/software-engineer-salary-SRCH_KO0,17.htm.
¹¹. Paula Clapon, “Can the tech industry solve the employee tenure problem?,” Hppy, August 30, 2016, , accessed April 10, 2017, http://www.gethppy.com/employee-engagement/can-tech-industry-solve-employee-tenure-problem.
¹². Global Workplace Analytics, “Federal Telework – Return on Taxpayer Investment,” Global Workplace Analytics, January 1, 2016, , accessed April 10, 2017, http://globalworkplaceanalytics.com/telecommuting-statistics.
¹³. Energy Information Administration (EIA)- Commercial Buildings Energy Consumption Survey (CBECS) Data. May 20, 2016. Accessed April 11, 2017. https://www.eia.gov/consumption/commercial/data/2012/#b6-b10
¹⁴. Fry, Richard. “Millennials surpass Gen Xers as the largest generation in U.S. labor force.” Pew Research Center. May 11, 2015. Accessed April 10, 2017. http://www.pewresearch.org/fact-tank/2015/05/11/millennials-surpass-gen-xers-as-the-largest-generation-in-u-s-labor-force/.
¹⁵. Schiada, Amber, and Julia Georgules. “Tech Employment Trends: Continuing to lead the pack.” Jones Lang LaSalle. 2016. Accessed April 10, 2017. http://www.us.jll.com/united-states/en-us/Research/US-Tech-Employment-Trends-2016-JLL.pdf.
¹⁶. Ponsen, Adrian. “Trends in Square Feet per Office Employee | NAIOP.” NAIOP Commercial Real Estate Development Association. April 2015. Accessed April 10, 2017. http://www.naiop.org/en/Magazine/2015/Spring-2015/Business-Trends/Trends-in-Square-Feet-per-Office-Employee.aspx.
¹⁷. Haltiwanger, John, Ron S. Jarmin, and Javier Miranda. “Who Creates Jobs? Small versus Large versus Young.” Review of Economics and Statistics 95, no. 2 (May 2013): 347-61. doi:10.1162/rest_a_00288.
¹⁸. Meyer, Klaus E., and Gabriel R.g. Benito. "Where do MNEs locate their headquarters? at home!" Global Strategy Journal 6, no. 2 (2016): 149-59. http://www.klausmeyer.co.uk/publications/2016_Meyer_Benito_GSJ.pdf
¹⁹. Kirk, Patricia. "Office Landlords Invest in Incubators for Tech and Bioscience Start-Ups." National Real Estate Investor. March 9, 2017. Accessed April 10, 2017. http://nreionline.com/office/office-landlords-invest-incubators-tech-and-bioscience-start-ups
²⁰. Neilly, Gallen. "Innovative Reuse of Kaiser Center's Mall Complete With Opening of The Port Workspaces Campus." Alameda, CA Patch. June 02, 2016. Accessed April 10, 2017. https://patch.com/california/alameda/innovative-reuse-kaiser-centers-mall-complete-opening-port-workspaces-campus-0
²¹. Mike Cassidy, " A Presentation to The Entreprenuer’s Club: 'Start-up King' Mike Cassidy: How to build 4 successful companies in a row" LinkedIn SlideShare, January 17, 2011, , accessed April 12, 2017, https://www.slideshare.net/staskh/best-strategy-isspeed4companies.
1 2 3